

Production Possibility Curve
TYS 2023 Q1
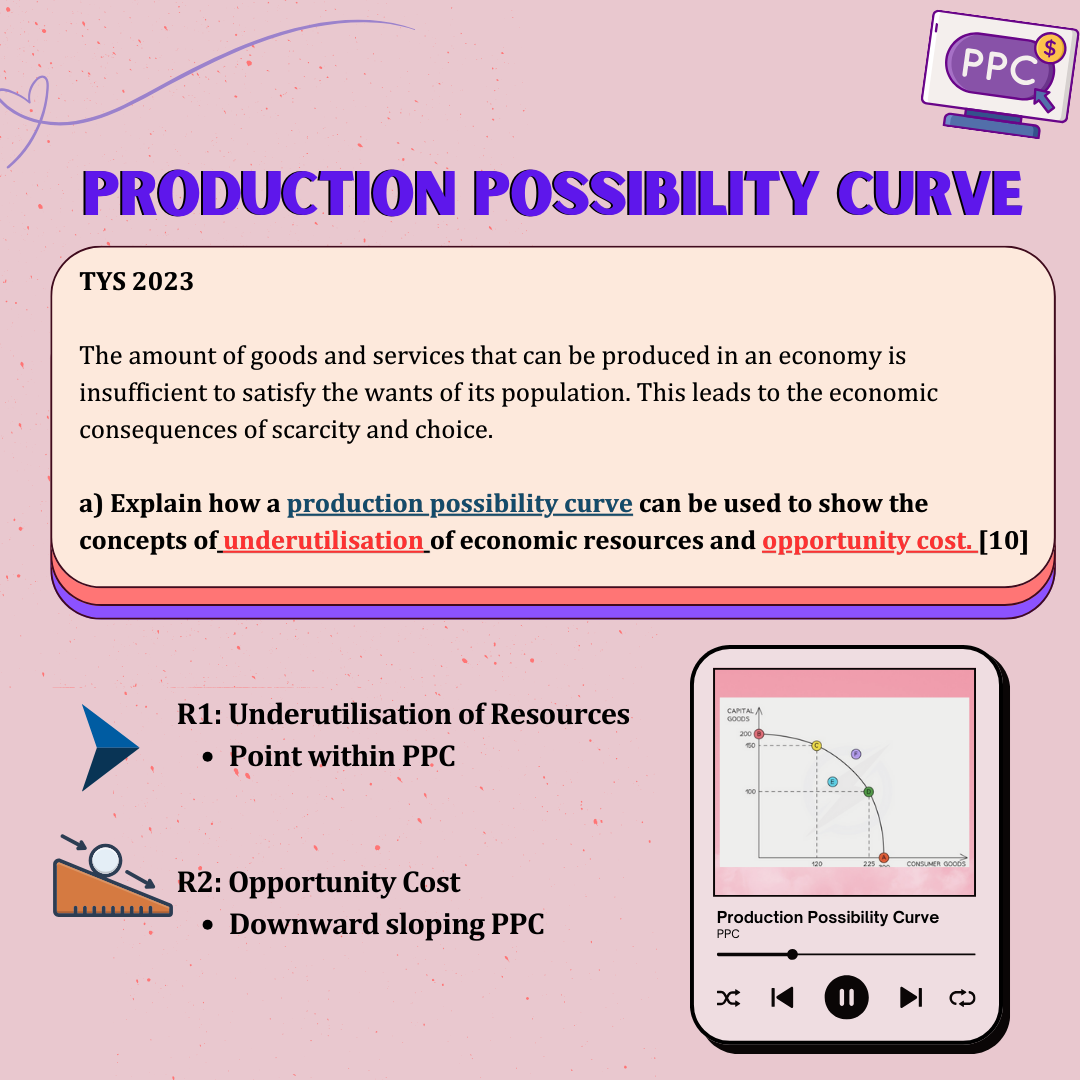
The amount of goods and services that can be produced in an economy is insufficient to satisfy the wants of its population. This leads to the economic consequences of scarcity and choice.
a) Explain how a production possibility curve can be used to show the concepts of underutilisation of economic resources and opportunity cost. [10]
Introduction
A production possibility curve (PPC) shows all the maximum attainable combinations of two goods that a country can produce within a specified time period with all its resources fully and efficiently employed, at a given state of technology. A PPC curve can be used to illustrate the concept of underutilisation of resources such as capital, entrepreneurship, land and labour, as well as opportunity cost which is defined as the next best opportunity forgone.
R1: Explain how PPC can show underutilisation
The concept of underutilisation of resources can be demonstrated using a point within the PPC curve. This is because the point within a PPC curve indicates that the economy could have increased production to a point on the PPC curve, which shows the maximum possible combination of goods the country could have produced if all resources were fully employed. For example, at point A, the economy is only producing 10 units of consumer and 10 units capital goods as it is not fully utilising its available resources. This could be a result of either unemployment or underemployment. However, if the country were to increase the utilisation of its labour and reduce unemployment, the country could have instead increased its production to point B. At point B, the economy is able to produce its maximum output of 10 units of consumer goods and 20 units of capital goods. Hence, a point within the PPC represents an underutilisation of resources.

R2: Explain how PPC can show opportunity cost
The concept of opportunity cost can be illustrated by the downward sloping PPC curve. This is because in order to increase the production of capital goods, the next best alternative or consumer goods will have to be forgone. For example, suppose that the economy is currently producing at point C where there is 5 units of consumer goods and 10 units of capital goods. If a country would like to increase its number of consumer goods to 10 units, it will have to produce at point D where there is 10 units of consumer goods and only 4 units of capital goods as the PPC curve illustrates the maximum number of goods the economy can produce. This means that in order to produce an additional 5 units of consumer goods, an opportunity cost of 6 capital goods will have to be forgone. This hence illustrates the concept of opportunity cost.
Conclusion
Hence, a point within a PPC curve can be used to show underutilisation of recourse, while the concept of opportunity cost can be illustrated by the downward sloping PPC curve.